Thread Rating:
  • 0 Vote(s) - 0 Average
  • 1
  • 2
  • 3
  • 4
  • 5
Parametric curves
#11
Still doesn't work for me with the latest version(*). I would have expected an anchor every 45° instead of every 120°.


(*) the one which is 111881 bytes. I strongly suggest that:
  • There is at least a version number (and if possible a changes history) in the header. For instance in my own code:
Code:
#!/usr/bin/env python
# -*- coding: utf-8 -*-
# Create a lumnosity mask for the current layer # (c) Ofnuts 2019
#
#   History:
#
#   v0.0: 2019-11-14: Initial version
#   v0.1: 2019-11-14: Fix DDD curve (thanks Blighty)
#   v1.0: 2019-11-16: Add custom masks
#   v1.1: 2019-11-18: Add general "Initial luminosity" mask
#   v1.2: 2019-11-21: Use the possibly more correct HISTOGRAM_LUMINANCE in Curves
#   v1.3: 2019-12-01: Revert use of HISTOGRAM_LUMINANCE in Curves
#
#   This program is free software; you can redistribute it and/or modify
  • The ZIP is versioned to follow the code it contains.
Reply
#12
I shall take it as a habit to write the history. I am a newcomer, and even writing lots of comments in the code is something I had to learn just to be able to develop my own code later.

You are trying to put the custom parameter values in the GUI as a list. That is something I did not come to think of. The format is just the values separated by commas. I shall see if I can make it to accept both ways. But not today, perhaps tomorrow.
Reply
#13
(03-14-2020, 06:38 AM)Ottia Tuota Wrote: You are trying to put the custom parameter values in the GUI as a list. That is something I did not come to think of. The format is just the values separated by commas. I shall see if I can make it to accept both ways. But not today, perhaps tomorrow.

This is what you told me to do here?
Reply
#14
I did not mean to tell that, but I expressed myself badly. I was trying to say that in the GUI the format for custom parameter values is: the values separated by commas. Like this: pi/2, pi, 3*pi/2, 2*pi

But there is the other method to feed the inputs to the plugin: The plugin can be told to read an input file. In that method one can write in the file
Code:
custom_params = [k*pi/2 for k in range(4*N)]

To use this method one has to:

1. Create a file where the inputs are. (A small Python file. The format is explained in doc.pdf)
2. In the GUI click "Read inputs from a file" to Yes.
3. In the next entry choose the file where the inputs are.

Sorry about this confusion. I have been making this plugin so long that my solutions have  become quite obvious to me, and it is hard to explain everything to somebody else clearly enough. Another thing where there is much to learn.

But I believe that I can quite easily make the plugin accept what you were trying to put in the GUI. Coming soon.

I would like to say a couple of words about why I decided to have these two ways to feed the inputs to the plugin: (1) typing everything in the fields in the GUI, or (2) creating a small Python file where the inputs are.

Method (1) is easy and good for a quick work. But if the functions x(t) and y(t) are complicated, this is tedious.

Method (2) allows much more complicated parametric curves, even such that cannot (in practice) be written in the form f(t)=(x(t),y(t)). And if it is complicated, it is much more comfortable to write it in a file, editing, changing, and saving at will.
Reply
#15
I updated the plugin. It now accepts python lists in the GUI for the custom parameter values. The old format is also accepted. I also updated the documentation file doc.pdf acordingly. The text in the GUI is changed for the custom values. The new version 0.9.3 is in the same place where the old was.

The spiral in Ofnuts' post #11 now looks as follows, when run up to 20*pi:


All further comments are very welcome.
Reply
#16
Here is my next plugin to draw parametric curves, the more complicated one. This is an introductory post. I shall soon make another post with more pictures.

To get the plugin, go to

http://kmarkku.arkku.net/

click the link Parametric Curves, scroll down to the bottom and click the Download button. You receive a .zip file which contains three items:

- parametric_curves.py (this is the plugin)
- doc.pdf (the documentation)
- folder example_files (see the site for explanation).

Unzip the .zip file, put the file parametric_curves.py in your Gimp's plug-ins folder, and restart Gimp. The new plugin has name 'Parametric curves' and it will be in Gimp's menu at

     Filters / Render / Parametric curves.

This plugin has, just as the simple one, two ways to pass the inputs:

1. By typing everything in the GUI.

2. By writing the inputs in a small Python file (in a specific format!) and then invoking that file in the GUI.

If the inputs are just typed in the GUI, there is not much different from the simple plugin. The big differences come when one feeds the inputs in a file. In this post I talk only about the GUI (about the are alternative in a later post).

The GUI of the new plugin differs from the simple one just in three respects:

1. New option "Fit in the window". Makes the drawing to fill the window. When this is Yes, the inputs for origo and scale are ignored.

2. New option to mark the coordinate axes as guides.

3. The level goes 1..100. (Not very essential and may change in the future.)

But there is one crucial difference between the plugins: the inner workings. The simple plugin often requires some help from the user (custom values for t). This plugin, on the contrary, normally manages without such help. When starting with some parametric curve, it first searches the curve for some special points on the curve and makes an initial subdivision from those, so dividing the curve into smaller arcs. Only then it starts building the approximate Bezier curve, working with each smaller arc separately.

The user need not care about all that. The new plugin just works better than the simple one, normally without requiring any input list of custom parameter values. (But such list can be inputted if needed. For example, if the curve has cusps, the plugin should find them on its own but they will not be quite exact.)

Here is a picture. This is the same spiral as in posts #11 and #15 above except that the arc is drawn up to 20*pi-pi/4.
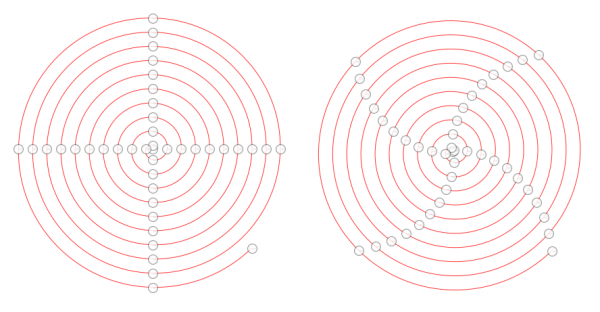
   

On the left is the result from the simple plugin with an input list of custom parameter values to create anchors separated by 90 degrees arcs.

On the right is the same spiral with the new plugin, with no custom anchors inputted so that the plugin works on its own.

As you can see, the simple plugin puts anchors exactly where it is told to. The new plugin finds some anchor points by its own inner algorithms, and the result is also very good.

You may ask how the new plugin chooses the initial subdivision. For a general answer, see doc.pdf and there Section 2.4 c2bo. (Or ask here and I will explain.) But for this particular curve the subdivision would consist of 90 degrees arcs, except that since the interval [0, 20*pi-pi/4] cannot be divided in equal parts that way, a little shorter arcs are used. (The value 90 degrees is the default and cannot be changed in the GUI, but it can be changed when inputs are read from a file.)

This was about the GUI. I shall soon make another post with pictures to show what can be achieved when the inputs are passed in a file.

If you have any questions, please ask.
Reply
#17
In this post I show some examples of what the plugin Parametric curves can do when the inputs are passed to it in a file. This is much more powerful than merely typing inputs in the GUI. Indeed, to take full benefit of the plugin, this is the way to go.

Below are five examples. They are drawn by the plugin taking inputs from a file. The five input files are found in the folder example_files in the .zip file. And there are many more. If you get interested, you can try all the example files in the folder one by one to see what they draw. You can also read the files (Python code) and perhaps try to make changes. And when looking at the results, please take notice of the main feature of the plugin: the control points on the paths will be indeed sparse even when the approximation is rather good!

1. The curve astroid is defined by f(t) = (cos(t)**3, sin(t)**3). It has four cusps. To get the cusps right they can be inputted as custom parameter values as is done here, but this plugin does find them rather well even without any help.


2. The GUI allows inputting functions in the form f(t)=(x(t),y(t)). But when the inputs are taken from a file, the user has available all resources of programming. As an example, the following figure is a result of playing with the equation of astroid.


To define the curve, the input file defines the parametric function as follows:

Code:
def astroid_play(t):
   R = 0.75                   # Choose a number between 0.5 and 1
   x,y = cos(t)**3, sin(t)**3 # Astroid
   r = sqrt(x**2 + y**2)      # Radius
   r1 = R + abs(r-R)          # To reflect points with r<R in circle r=R
   r1 = r1**2                 # To get stronger effect
   return [(r1/r)*x, (r1/r)*y]

Just think what a job it would to type this function in the GUI as x(t) and y(t)! And in the GUI there is no way to save what one typed!

3. The plugin is designed to draw several parametric curves in the same picture, another central feature. (That is not possible in the GUI, and not at all with the simple plugin.) Here is an example where there are two circles and one ellipse. In addition there are some line segments; that is another feature of the plugin.


4. A rose or rhodonea has the polar equation r = cos(kt)+c; for the formula and other info see

https://en.wikipedia.org/wiki/Rose_(mathematics)

One of the example files is an implementation of the case k = a/b where a,b are integers. The case a,b,c = 5,6,0 looks as follows (edit the file if you want to try others):


5. The final example here is the graph of the normal distribution. The curve is the Bezier approximation. In the same picture the little stars show where the exact curve would run. That is another feature, meant to enable the user to see quite visually how good or bad the approximation is. We see that in this example at least the approximation is satisfactory.


For preliminaries on writing such input files, please see the documentation file doc.pdf. Another source of help is the example files. And the folder example_files has a subfolder called templates which contains three template files. They are meant to easify writing input files.

And of course, you can come here and ask any questions. If you have some figure you would like to create, just ask and perhaps I can help.
Reply


Forum Jump: